Skip to content
DATA VIBE
DATA VIBE
  • Home
  • About Data Vibe
  • Blogs
  • Speaking Engagements
  • Contact Us

Tag: data visualisation

21/07/202326/07/2023 Pragati Jain Blog Post conditional formattiong, data visualisation, Power BI, Tips & Tricks1 Comment on Icons & Data Labels on Top of the Bars with Conditional Formatting

Icons & Data Labels on Top of the Bars with Conditional Formatting

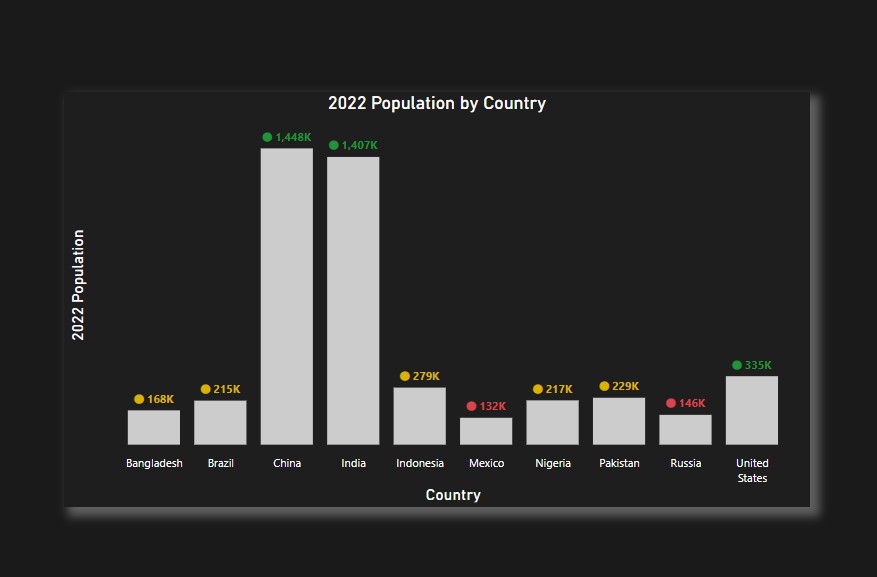
“A day without a challenge, is a day without a learning!” Today, I got a requirement from a client, where they asked

Read More

30/06/202330/06/2023 Pragati Jain Blog Post data visualisation, Power BILeave a Comment on Power BI – The New Card Visual Part 1

Power BI – The New Card Visual Part 1

Current month Power BI update has got so many additions to it from having new card visual to Power BI Developer Mode;

Read More

25/02/202220/06/2023 Pragati Jain Blog Post data visualisation, Power BI, storytellingLeave a Comment on Spotify Trends

Spotify Trends

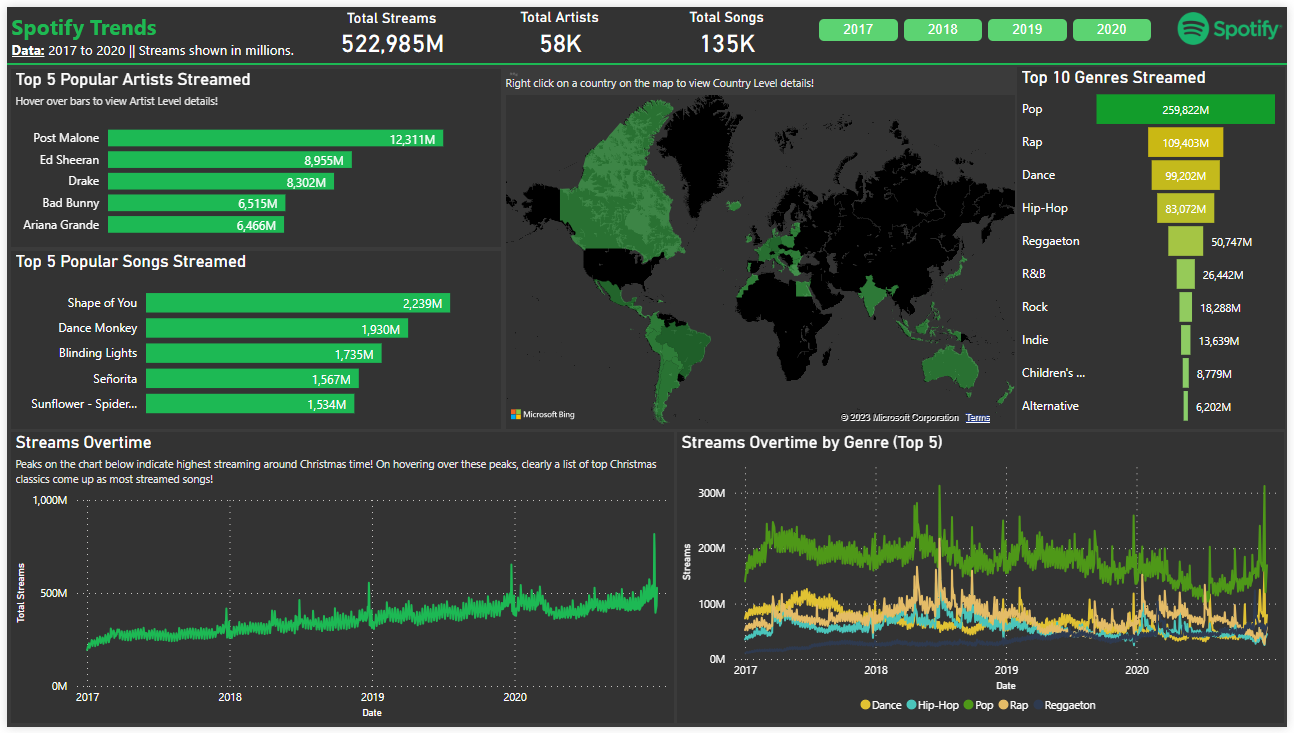
Hello Everyone, Some new data this time, some new trends and some new insights. This time I have taken data related to

Read More

04/02/202220/06/2023 Pragati Jain Blog Post data visualisation, Power BI, storytellingLeave a Comment on Global Oil Production and Consumption Analysis

Global Oil Production and Consumption Analysis

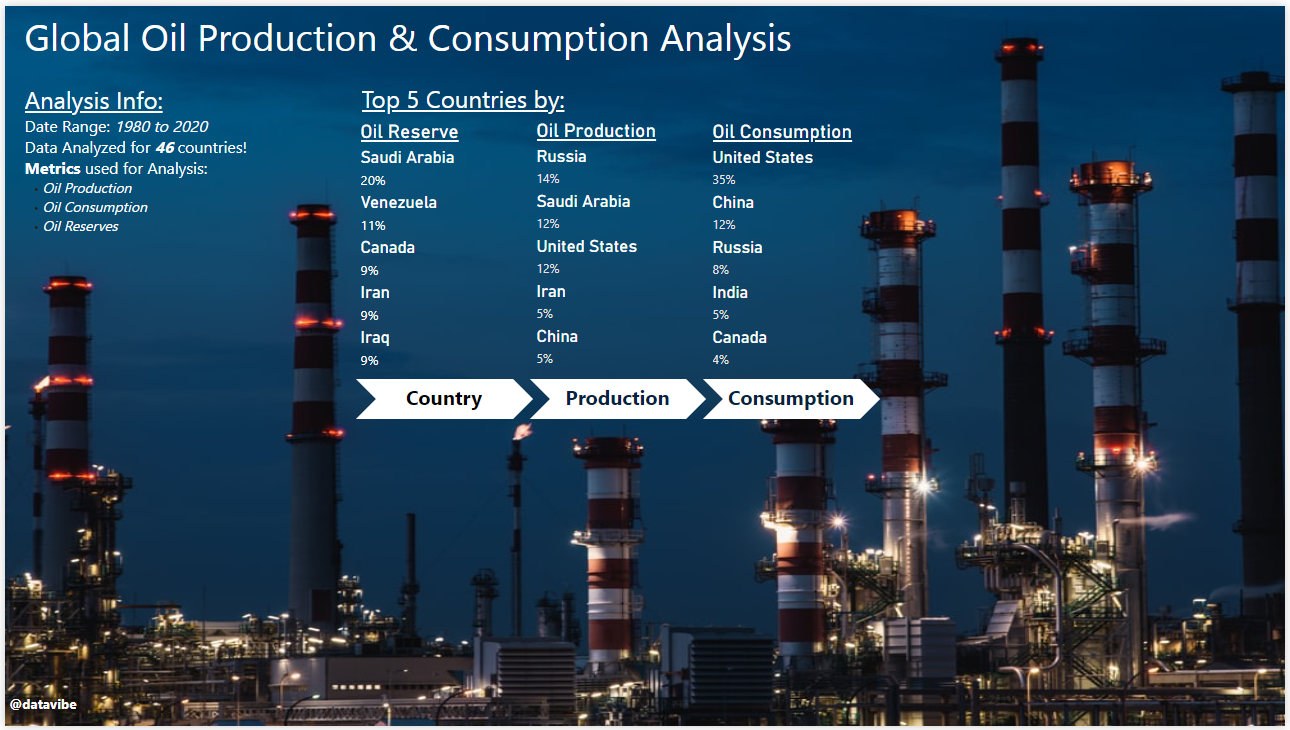
Hello Everyone, This month’s data story shows some new trends and insights.This month I have taken data related to the Global Oil Reserves,

Read More

02/01/202212/03/2025 Pragati Jain Blog Post data visualisation, Power BI, storytelling2 Comments on Global CO2 Emissions Analysis

Global CO2 Emissions Analysis

Hello Everyone, This is my first post to storytelling on my blog. I will posting more data stories soon. CO2 emissions globally

Read More

Copyright © 2023 Data Vibe - All Rights Reserved.